
README.md
The README.md file gives information about posts I wrote and has links to all of them. There are links to projects, which are in pdf format as well. It describes the contents of each post briefly, in order to make it easier for the reader to find what he or she is looking for.
Special Projects
Bachelor Thesis
Hyperparameter Optimisation
For Real Estate Prediction Models
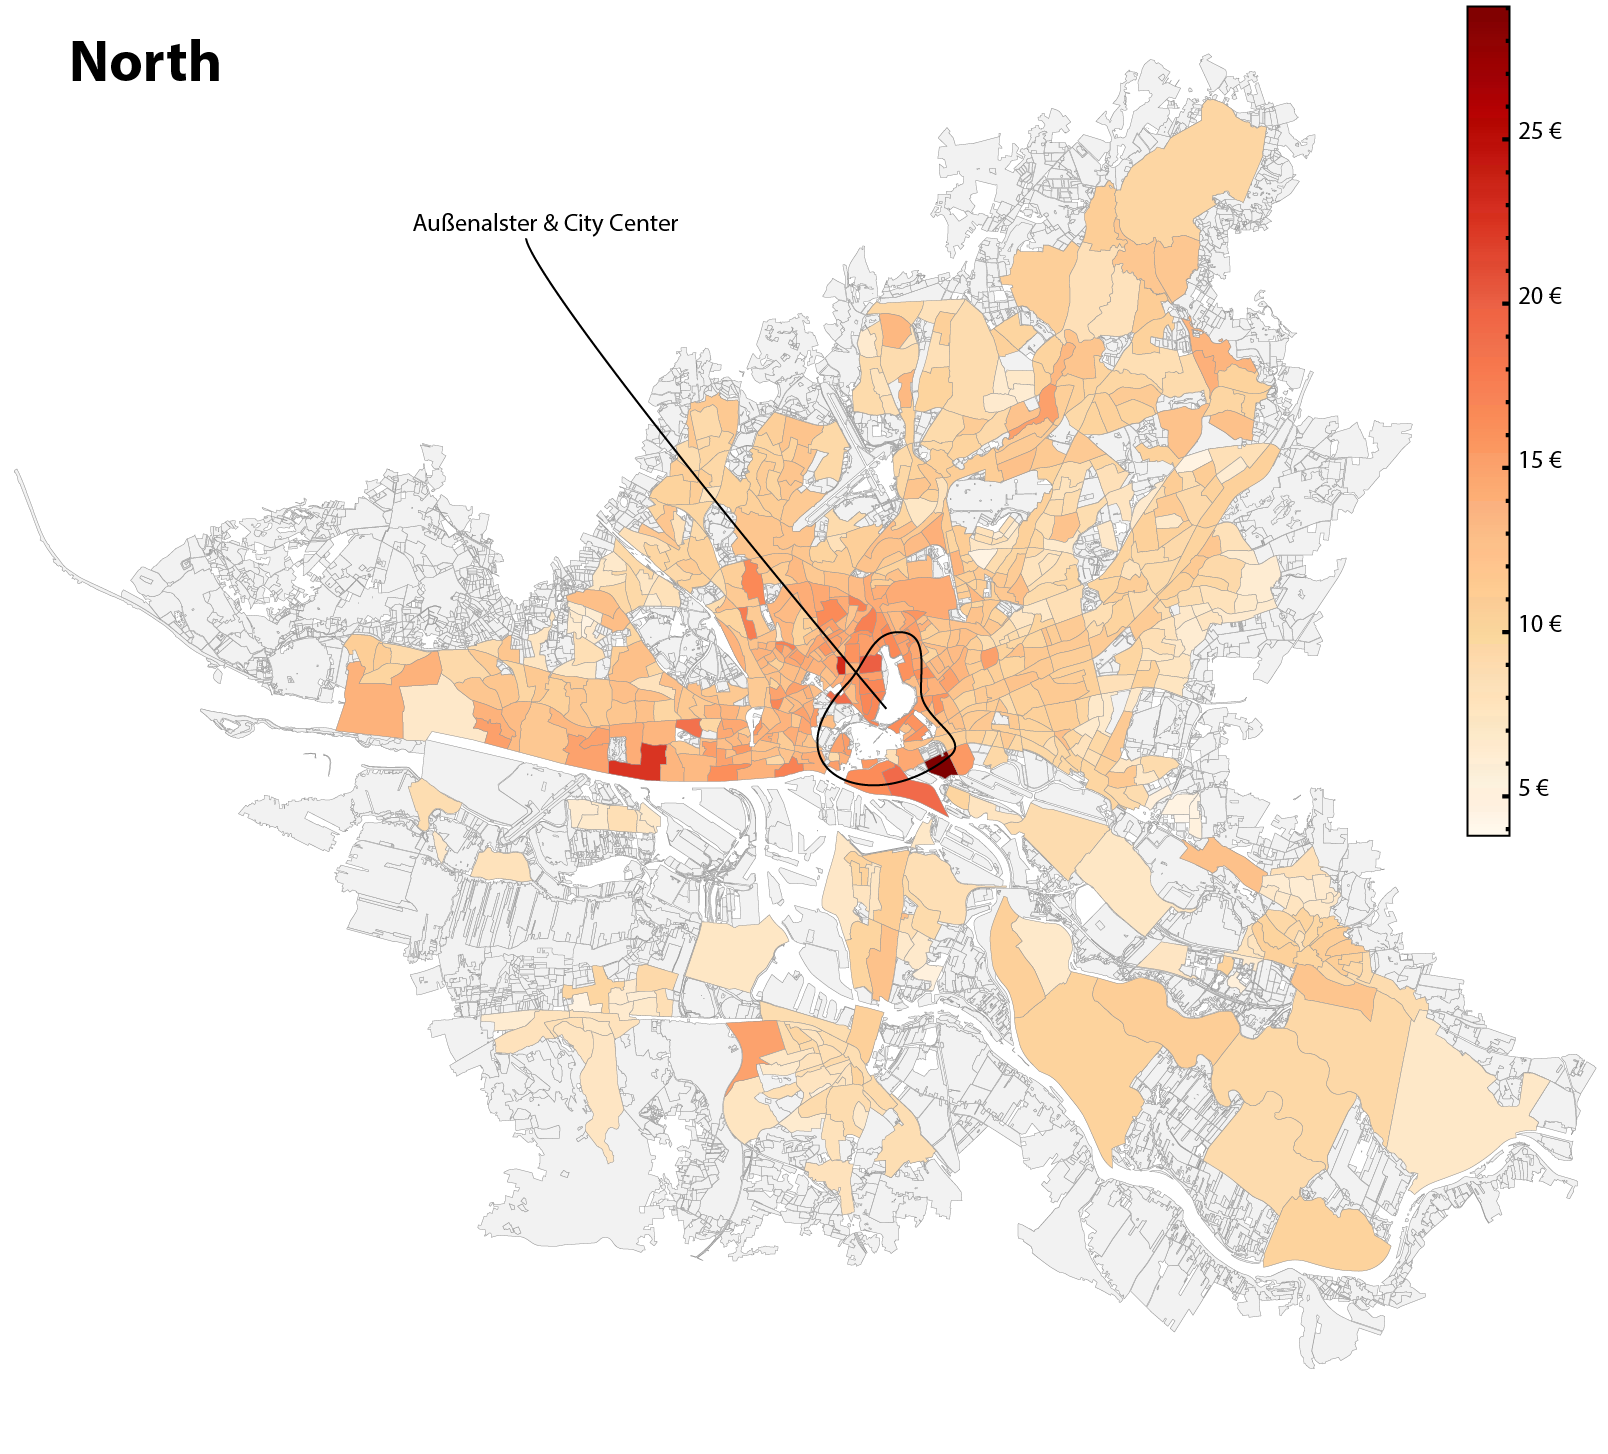
Graphic shows the heat map of the base rent per square meter variable across the federal state of Hamburg, Germany.
A pdf version of the entire Bachelor Thesis (98 pages) can be accessed and downloaded here: Klein - Real Estate Prediction Models
Abstract
English Version
Combining a highly scalable and customisable process, with very accurate prediction results using machine learning models, is what this work proposes. The customisation is guided by what information the user seeks to gain from the process. This makes the process applicable for a variety of sectors, such as Banking & Finance, Marketing and urban development among others. It evaluates the process of using self-acquired data from an online real estate platform, gained from deploying a custom web scraping algorithm. This data is then combined with several spatial features for predicting the base rent for apartments on a validation dataset. The analysis and predictions are made for rental apartment listings within the Hanseatic City of Hamburg. The spatial features originate from sources other than that of the apartments data and have to be adapted to it first, therefore. Predictions are made using state of the art machine learning models, in the form of a Lasso Regression model and a XGBoost Regressor model. The Hyperparameter Optimisation techniques grid search and random search are compared, during the optimisation process. The focus is on maximising prediction accuracy of the models. The best scores, expressed in RMSE, are 190.68 for the Lasso and 115.39 for the XGBoost Regressor. Differences in complexity and interpretability between the models are discussed and associated with it, the strengths and weaknesses of the respective model are pointed out.
German Version
Die Kombination eines hoch skalierbaren und anpassbaren Prozesses mit sehr präzisen Vorhersageergebnissen unter Verwendung von Machine Learning Modellen ist der vor- geschlagene Ansatz dieser Arbeit. Die Anpassung richtet sich danach, welche Informa- tionen der Benutzer aus dem Prozess gewinnen möchte. Dadurch ist der Prozess für eine Vielzahl von Sektoren anwendbar, wie zum Beipiel Bankwesen & Finanzen, Mar- keting und Stadtentwicklung. Es bewertet den Prozess der Verwendung von selbst gewonnenen Daten, die durch den Einsatz eines eigenen Web-Scraping-Algorithmus von einer Online-Immobilienplattform gewonnen wurden. Diese Daten werden dann mit mehreren räumlichen Merkmalen kombiniert, um die Kaltmiete für Wohnungen auf einem Validierungsdatensatz vorherzusagen. Die Analysen und Prognosen wer- den für Mietwohnungsangebote in der Hansestadt Hamburg erstellt. Die räumlichen Merkmale stammen aus anderen Quellen als denen der Wohnungsdaten und müssen daher zunächst an diese angepasst werden. Die Vorhersagen werden mit Hilfe mod- ernster Machine Learning Modelle in Form eines Lasso-Regressionsmodells und eines XGBoost Regressor-Modells getroffen. Die Hyperparameter Optimierungstechniken Grid Search und Random Search werden während des Optimierungsprozesses ver- glichen. Der Fokus liegt auf der Maximierung der Vorhersagegenauigkeit der Mod- elle. Die besten Ergebnisse, ausgedrückt in RMSE, sind 190,68 für das Lasso und 115, 39 für den XGBoost Regressor. Unterschiede in der Komplexität und Interpretier- barkeit zwischen den Modellen werden diskutiert und damit verbunden, die Stärken und Schwächen des jeweiligen Modells aufgezeigt.
TOC
1
2
3
4
5
6
7
8
9
10
11
12
13
14
15
16
17
18
19
20
21
22
23
24
25
26
27
28
29
30
31
32
33
34
35
36
37
38
39
40
41
42
43
44
45
46
47
48
49
50
51
52
53
54
55
56
57
58
59
60
61
62
63
64
65
66
67
68
69
70
71
72
73
74
75
76
77
  Abstract

1. Introduction

    1.1 Scope & Research Questions

    1.2 Outline

2. Related Work & Foundation

    2.1 Related Work

    2.2 Fundamentals

3. Methods & Data

    3.1 Specification of the Problem

    3.2 Model Selection

    3.3 Collection of Data

    3.4 Preparation of Data

    3.5 Spatial Joins

    3.6 Overview - All Variables

4. Exploratory Data Analysis

    4.1 Univariate Distributions

    4.2 Correlation

    4.3 Heat Map of Base Rent

    4.4 Preprocessing

5. Machine Learning

    5.1 Hyperparameter Optimisation

    5.2 Overview - RMSE Values

    5.3 Lasso - Interpretation of Coefficients

    5.4 XGBoost - Feature Importance

6. Evaluation

    6.1 Comparison of Results

    6.2 Hyperparameter Optimisation - Results

    6.3 Limitations & Future Work

7. Discussion & Conclusion

    7.1 Dataset Construction

    7.2 Hyperparameter Optimisation - Discussion

8. Summary

    8.1 Review

    8.2 Applicability of the Process

  Bibliography

  Annex

  List of Figures

  List of Tables

  Listings
Blog Posts & Projects
Tags and links to the blog posts and project posts I have published on this
site.
General Information
The following table explains certain notations, that are used in the
descriptions of the articles. They follow the general notation used in
comparable articles.
| Notation | Reference |
|---|---|
df |
pandas.DataFrame Object |
pd |
Alias for pandas Module |
df.some_method |
Alias for pandas.DataFrame.some_method |
Blog Posts
Multicollinearity: What It Is & Measures To Spot It.
Description: Two highly correlated distributions ($S1$, $S2$) are created
from scratch. A scatter plot of both distributions distributions is created,
with values on the x-axis from $S1$ and values on the y-axis from $S2$, to
display what collinearity looks like. Covariance along with the prerequisites
that need to be met for it to be a suitable metric, is first explored as a
metric to spot collinearity. The mathematical formula and a shortcut for
calculating it are presented. The second metric is the Pearson Correlation
Coefficient. It is described much like the Covariance, along with an
description the possible values of the correlation coefficient $r$. The articles
concludes with an example of how the Pearson Correlation Coefficient can be
used in a hypothesis test to determine, if $S1$ and $S2$ are at all correlated
with each other.
Tags: multicollinearity, covariance, Pearson correlation coefficient,
creation of two distributions that are tested for correlation, hypothesis test
to gauge if the two distributions are at all correlated with each other.
Using Pandas To Import CSV Data Into MySQL
Description: The problem, along with the solution, that this article offers
are presented. Following is a step by step guide, including the required python
libraries, of how to import the CSV data into a pandas DataFrame object and how
to export the DataFrame to a MySQL database as a MySQL table. The method was
used several times by the author to create a MySQL table with over $4E7$
rows.
Tags: MySQL, Python3 script, utility, pandas, DataFrame, pd.read_csv, sqlalchemy, sqlalchemy.create_engine, sqlalchemy.types: Integer, Float, Text, DateTime, pd.df.to_sql
Projects
Data Preparation Series Part 4: Exploring Tabular Data With Pandas
Description: Showcase of how batch processing several columns of tabular
data using pandas, pyjanitor and the re library can look like. Redundant columns are
dropped, columns are reordered by type. Columns with dtype categorical are
created and their classes converted to numerical values for the following
evalutation of candidate models.
Tags: pandas, pyjanitor, method chaining, cleaning of tabular dataset,
DataFrame, data validation using regex patterns, df.process_text,
df.find_replace, df.fill_empty, df.rename_column, df.loc, df.drop,
df.to_csv, df.info, df.reorder_columns, df.factorize_columns,
df.filter
Data Preparation Series Part 3: Creation Of Point Geometry Column gps + timedelta64ns Column
Description: Creation of a valid gps column for the records, by joining the
longitude and latitude columns together using geometry object Point from
library shapely.geometry. It lays the foundation for assigning from the
dataset completely independent geospatial features to the listings. Features
that prove significant for the prediction of variable ‘base_rent’ in the later
stages of the process. Further, a dtype timedelta64[ns] column is created
using datetime64[ns] type columns ‘date_listed’ and ‘date_unlisted’ to
calculate how long a listing was listed for on the platform
‘immoscout24.de’.
Tags: pandas, pyjanitor, method chaining, cleaning of tabular dataset,
DataFrame, data validation using regex patterns, df.drop, df.process_text,
df.change_type, df.dropna, df.to_datetime, df.fill_direction,
df.truncate_datetime_dataframe, df.add_column, df.transform_column,
df.describe, shapely.geometry.Point
Data Preparation Series Part 2: Foundation For Cleaning 47 Column Wide Tabular Data With Janitor & Pandas
Description: The DataFrame is explored and columns are processed and cleaned
to give insight into how many values are missing among other properties.
Tags: pandas, pyjanitor, method chaining, cleaning of tabular dataset,
DataFrame, data validation using regex patterns, df.rename_column,
df.clean_names, df.remove_empty, df.drop, df.fill_empty,
df.find_replace, df.value_counts, df.process_text, df.change_type,
df.value_counts, df.value_counts, string_functions: extract, replace,
lstrip, rstrip, regular expressions
Data Preparation Series Part 1: Exploring The 47 Column Wide Tabular Dataset Using Pandas
Description: An Overview of available tools in the pandas library.
Tags: df.head, df.tail, df.index.max, df.columns, df.index,
df.shape, df.count, df.describe, .to_markdown, df.nunique, df.filter,df.sample,df.value_counts,df.drop_duplicates
-
Chapter 5: Section 13
Description: The systemctl command.
Tags: systemctl, shell, bash, centos 7.9, system administration, ssh,
virtual machine
Chapter 5: Section 12
Description: Processes, jobs and scheduling.
Tags: application, script, daemon, threads, job, shell, bash, centos 7.9,
system administration, ssh, virtual machine directory services & system utility
commands
Chapter 5: Section 10 & 11
Description: Overview and comparison of popular directory services.
Tags: directory services, active directory service windows, identity manager
red hat, winbind samba linux to windows, openldap red hat, ibm directoryserver,
jumpcloud, ldap protocol, date, uptime, uname, which, cal, bc,
shell, bash, centos 7.9, system administration, ssh, virtual machine
Chapter 5: Section 8 & 9
Description: Communicating with users & linux account management.
Tags: users, wall, write, local account, domain account, shell, bash,
centos 7.9, system administration, ssh, virtual machine
Chapter 5: Section 7
Description: Monitoring users.
Tags: who, last, w, finger, id, shell, bash, centos 7.9, system
administration, ssh, virtual machine
Chapter 5: Section 6
Description: How to switch users and sudo access.
Tags: sudo, visudo, su - username, shell, bash, centos 7.9, system
administration, ssh, virtual machine
Chapter 5: Section 5
Description: chage command in depth.
Tags: chage, shell, bash, centos 7.9, system administration, ssh, virtual
machine
Chapter 5: Section 4
Description: User account management.
Tags: useradd, groupadd, userdel, groupdel, usermod [-G], shell,
bash, centos 7.9, system administration, ssh, virtual machine
Chapter 5: Section 3
Description: The sed command for text manipulation.
Tags: sed command, shell, bash, centos 7.9, system administration, ssh,
virtual machine
Chapter 5: Section 1 & 2
Description: Linux text editors.
Tags: vi, vim, nvim, emacs, shell, bash, centos 7.9, system administration,
ssh, virtual machine